By Supaorder Team — who we are
The Nine Customer Segments, Explained
What each of the nine automatic customer segments means, how the thresholds behind them are set, and what to actually do with each one.
Owning your ordering channel means owning the customer data that comes with it. That is only worth something if the data is usable, and a list of ten thousand people is not usable — a list of the four hundred who used to order weekly and stopped is.
Supaorder scores every customer from their real ordering history and places them into segments automatically. There is nothing to maintain: no lists to build, no exports, no tags to apply by hand, and the segments stay current as behaviour changes. This post is what each one means and what it is for.
Two axes, nine segments
The segments sit on two independent axes, which is why a customer can hold several at once — most active and high spender is a normal, useful combination rather than a conflict.
Five describe behaviour:
| Segment | Who is in it | What it is for |
|---|---|---|
| VIP | Your best customers overall | The people to protect. Early access, a members-only item, the offer you would not send everyone. |
| High spender | High total spend | Similar audience, different reason — these are people who have given you a lot of money over time, whether or not each order is large. |
| High AOV | A high average order value — fewer, larger orders | Families and group orders. Upsells and bundles land here; a “spend $5 more” nudge does not, because they already do. |
| Repeat | Orders again and again | The core of the business. Worth measuring more than marketing to — this slice is your retention scoreboard. |
| At risk | A good customer whose ordering is tailing off | The highest-value segment on the list, because it is the only one where a message changes the outcome. |
Four describe lifecycle stage: New, Active, Most active and Lapsed. Those are about when someone last ordered and how often, independent of how much they spend.
The pairing is where it gets useful. A high spender who is also lapsed is a different problem from a new customer who is also lapsed: one is a relationship that broke, the other is a first order that never became a second.
The thresholds are yours, and the defaults are a starting point
What counts as a high spender in a city-centre restaurant is not what counts in a supermarket, so every threshold is configurable: what makes a customer VIP, active, lapsed, at risk, new, a high spender or a high-AOV customer, and the recency, frequency and monetary bands used to score them. They live in the dashboard under Settings → Configuration → Global, in the Customer Segmentation section.
Set them against your own numbers rather than leaving the defaults. The single most useful starting point is the typical gap between orders for one of your regulars. If a regular orders roughly every ten days, then:
- At risk should sit a little over that gap — long enough that it means something, short enough that you can still act.
- Lapsed should be a multiple of it.
Get those two numbers right and you have done more for retention than any offer you can design. Get them wrong in the obvious direction — “lapsed” set to 90 days when your customers order weekly — and you find out someone has gone three months too late to do anything about it.
Churn risk sits alongside, and it is sharper
Each customer also carries a churn risk of low, medium or high, derived from how their recent behaviour compares with their own history rather than with an absolute threshold.
That comparison is what makes it more sensitive than “lapsed”. A weekly customer who has slipped to fortnightly has not lapsed by any threshold you would sensibly set, and is quietly on the way out. Churn risk catches them; a date-based rule cannot. It is available as a filter when building an audience, so you can act on it directly.
Where the segments actually get used
They are not just a report. The same segments are inputs to the tools that send things:
- Broadcast — as an audience filter for SMS, email or push, alongside spend, order count, wallet balance, reward points and churn risk.
- Marketing Autopilot and Promotions — as trigger conditions, so an automated voucher only fires for the customers you meant. Autopilot handles the recurring cases (welcome, lapsed, birthday, visit milestone) with cooldowns and a monthly cap; Promotions sends a one-off voucher to a segment you choose.
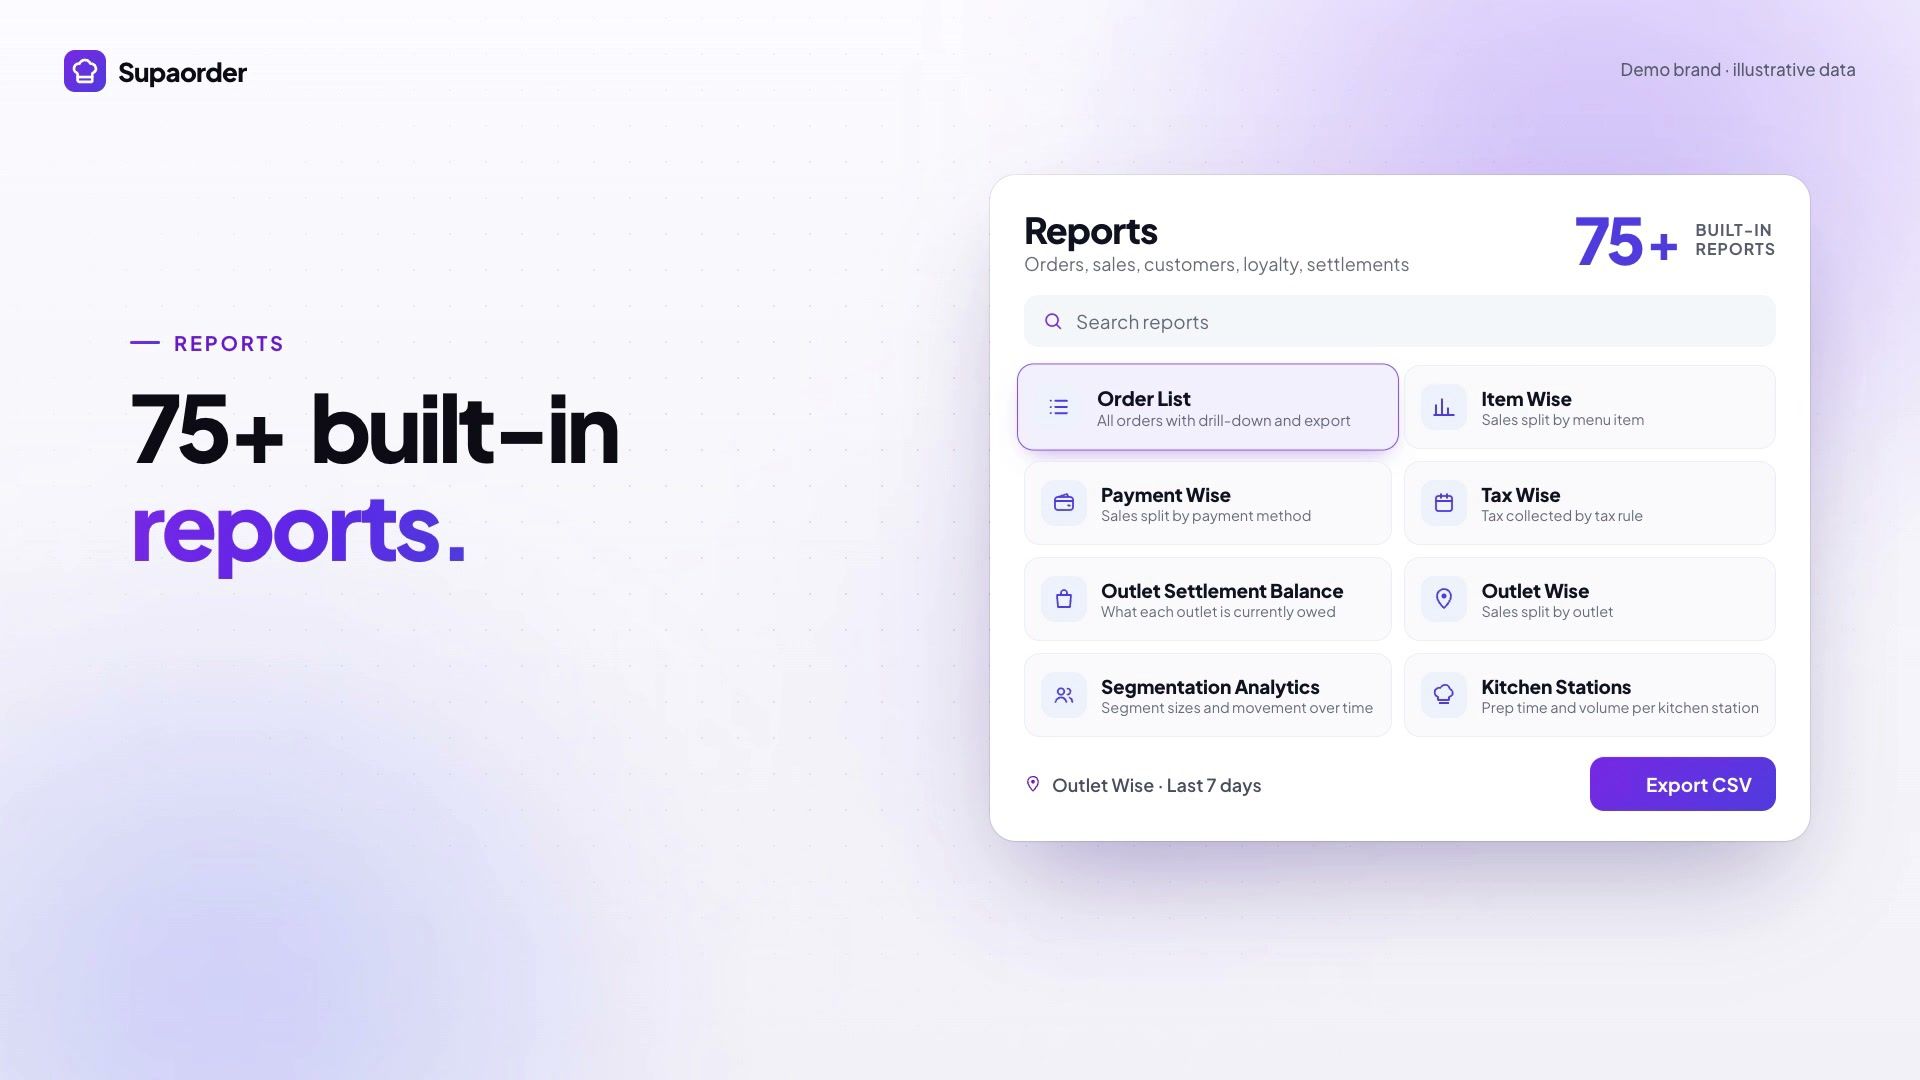
- Segmentation Analytics — the shape of your customer base and how it is shifting.
- Customer records in reports and in the partner app, so staff can see who they are dealing with at the counter.
Every send reports back what was delivered, accepted and redeemed, which is what lets you tell a campaign that worked from a campaign that was merely sent.
Reading the report: movement, not the snapshot
A single month’s distribution says very little. The direction says a lot, and three patterns are worth watching for:
- A growing Lapsed slice means retention is leaking — whatever your total order count is doing. This is the one that hides behind a good month.
- A growing New slice with a flat Repeat slice means you are buying customers who do not come back. That is an onboarding problem, not an acquisition one, and more marketing spend makes it worse rather than better.
- A shrinking At risk slice after a win-back campaign is that campaign working. It is also the cleanest read you will get on whether a retention offer earned its cost.
Ten minutes once a month, even in a month you are running no marketing at all.
When something looks wrong
| Symptom | Usual cause |
|---|---|
| Everyone is in one segment | The thresholds are far from your real numbers. Start again from the reorder gap. |
| A customer looks misplaced | Segments are recalculated on a schedule, so a very recent order may not be reflected yet. |
| A campaign reached nobody | Trigger conditions can combine into an empty audience. Loosen one at a time rather than all at once. |
| Segments are missing from a report | Some reports depend on which modules are enabled. |
The point of all of it
Segmentation is not a feature you switch on and admire. It is the thing that turns “we have customer data now” into a specific, small, worthwhile action: four hundred people who used to order weekly, one message, one reason to come back.
The full reference — every threshold, how churn risk is derived, and where segments appear across the product — is in the documentation. If you want to see it running against a real store’s data, book a demo.